

DashClicks Blog
The industry's top experts offer their best advice, research, how-tos, and insights—all in the name of helping you level-up your business and online marketing skills.
Join Us!
.svg)
.svg)
.svg)
.svg)
.svg)

How to Measure and Report Social Media Success
Most businesses use social media, but not all businesses know how to measure and report their social media success. As the marketing world evolves, companies must learn how to properly measure and report their social media success to make informed decisions about their marketing strategies.
This blog post will show you how to measure and report your social media success properly. By following these tips, you'll be able to ensure that your business is getting the most out of its social media presence.
What Are Social Media Goals?
A social media presence is an important component of successful modern digital marketing. As such, it is essential to establish a clear set of objectives and expectations to ensure that social media efforts are properly aligned with business goals. An effective strategy should consider core goals such as brand awareness, engagement, increased website traffic, and capturing relevant data.

Image Source: SproutSocial
Additionally, each social platform should have unique goals that consider the target audience's demographic and demographic makeup. With a robust plan in place to identify these desired outcomes, businesses can effectively leverage the power of digital marketing on popular social media platforms to increase their reach and strengthen brand loyalty and overall online visibility.
Four Key Metrics to Measure Social Media Success
1. Visibility
The number of people who have seen your content, including those who have seen it organically and through paid campaigns. It can be measured by tracking the reach of your content on each social media platform.
2. Engagement
This metric measures how users interact with your brand, including likes, comments, shares, and mentions. It is a good indicator of user interest in your brand and how much people are invested in interacting with you on social media.
3. Conversion Rate
This metric measures the percentage of people who take a desired action, such as signing up for an email list or purchasing a product. It can help you measure the effectiveness of your social media campaigns.
4. Traffic
This metric measures how much traffic is driven to your website from social media. It can help you understand the effectiveness of your content and campaigns in driving users to your website.
Choose the Right Metrics to Measure Your Success - This Will Vary Depending on Your Goals
Measuring success is one of the most important aspects of any venture, no matter how big or small. Knowing the right metrics for each goal is essential for proper assessment. It's important to understand which metrics best measure your progress and growth ā the key metrics should represent your ongoing performance and help determine if you are reaching your goals.
The metrics should align with your overall vision, mission, and goals; it's important to have an accurate picture of what success looks like to move forward confidently. Assigning value to everybody's effort by tracking specific metrics can make a plan easier to monitor and manage over time ā ultimately making measuring success much more attainable!
Choosing the right metrics to measure your success or progress is essential when setting short and long-term goals. Doing this will give you insight into how well you're achieving your desired results, allowing you to adjust your strategy as needed for maximum efficiency.
How to Calculate the Engagement Rate on Social Media?
The engagement rate on social media is a key indicator of success for any social media marketing strategy. It is calculated by dividing the total number of interactions (likes, comments, shares) by the total impressions (number of people who viewed your post).

Image Source: SproutSocial
The higher the engagement rate, the more successful and impactful your post will be. Additionally, this metric can give you an idea of how people respond to your content and provide valuable feedback on improving it.
How to Calculate the Visibility on Social Media?
The visibility of your content on social media is an important metric to track to measure the success of a digital marketing campaign. It can be calculated by dividing the total number of views (impressions) by the total opportunities for viewers (reach).

Image Source: Porter
The higher the visibility, the more successful you will be in reaching and engaging with potential customers. This metric can also help you determine the success of your content within different demographics or platforms and identify areas for improvement.
How to Calculate the Conversion Rate on Social Media?
The conversion rate on social media is a key indicator of success for any digital marketing campaign. It is calculated by dividing the total number of conversions (leads, sales, etc.) by the total opportunities for conversions (number of people who viewed your post).
The higher the conversion rate, the more successful you will be in turning viewers into customers. This metric provides valuable feedback on how to improve the effectiveness of your content and campaigns.
Findings:
Once you've tracked the metrics mentioned above and analyzed the data, document your findings in an organized way that is easy for others to read and understand.
For example, create a spreadsheet or presentation that outlines the numbers and any trends or insights you notice. It will help you keep track of your progress, identify challenges and convert them to opportunities, and ensure everyone on your team is on the same page about where your social media campaigns are headed.
How to Calculate Traffic on Social Media?
The traffic you generate on social media is an important metric to measure the success of your digital marketing campaigns. The total number of visitors driven from social media channels can be calculated by subtracting direct traffic (visitors who typed in your URL directly) from total website visitors.
Additionally, you can use tools such as Google Analytics to track your website traffic sources and see how much you're getting from social media. Tracking traffic from social media can help you determine which platforms are most effective for driving user engagement and conversions.

Use Tools Like Google Analytics or Analytics Tool to Track Your Progress
Using tools like Google Analytics or an Analytics tool can be invaluable when it comes to tracking the progress of your digital marketing campaigns. You can access detailed reports and discover insights about your website visitors, demographics, and interests. Once you have identified areas for improvement, you can adjust your strategy and optimize for better performance. This way, you can design more effective ads that attract higher engagement from customers. With data-driven analysis of your campaigns, these tools offer you a chance to take your business to the next level.
You can also use DashClicks' Analytics app to track and monitor your social media campaigns. It offers real-time reporting and multiple integrations to give you everything you need to know about your campaigns in one place. It can also help you easily track your progress on key metrics so you can make changes to your campaigns and get better results.
Analyze Your Results and Adjust Your Social Media Strategy Accordingly
Assessing the effectiveness of your social media strategy is an important step to make sure it continues to be successful. Regular analysis can help you identify areas that need improvement and capitalize on growth opportunities.
By understanding analytics, you can gain insights into audience engagement, measure reach, and examine the performance of your posts and campaigns. You should use this data to make informed decisions about how you allocate resources, tweak the formats and content of your messages, and shift strategies as necessary to reach your desired goals.
With proper evaluation and adaptation, you can ensure that your social media efforts will continue to be effective.
Report Your Findings to Clients in a Clear and Concise Way
When reporting social media findings to clients, it is important to present the facts clearly and concisely. It ensures that all key information is absorbed and understood fully by all who receive it.
Having an accurate summary of the data you are presenting helps relay technical jargon and outlier numbers to laypersons so that they are able to better understand them. Furthermore, having a well-laid-out report helps you adequately communicate the impact of your findings, helping your clients make the most informed decisions possible.
You can also use DashClicks' InstaReports app to create in-depth reports on your social media campaigns that contains all the essential analytical output your clients need for their business. It is also highly useful in creating multiple reports in bulk, saving you time and resources.
Achieving success with social media requires careful planning and consistent effort as an agency. We listed some surefire tips in this blog post that can set you up for social media success. Define your goals, choose the right metrics to measure progress, use data-driven insights to adjust your strategy, and report your findings to your clients clearly and concisely.
Following these tips can help you achieve great things on social media with a little hard work.


A Guide to Google Analytics 4 (GA4) Dimensions for Agencies
Do you need help understanding the differences between Google Analytics 4 (GA4) Dimensions and Universal Analytics? GA4 is a powerful data collection and analysis tool for agencies, but it can be difficult to navigate without understanding the proper usage of its dimensions. In this guide, we'll provide agency owners and business owners with an overview of GA4's capabilities so that they can take full advantage of all its features.
We'll explore what makes GA4 different from Universal Analytics, which datasets are available for each dimension, how to utilize the feature in analytics reporting correctly, and real-world examples demonstrating its use in action.
What Is Google Analytics 4 (GA4), and How Is It Different From Universal Analytics?
Google Analytics 4 (GA4) is a new version of Google's popular analytics platform that was released in October 2020. It is an entirely new analytics system designed to provide users with more comprehensive insights into the performance of their websites and digital marketing efforts.
Unlike Universal Analytics, a legacy web analytics system, GA4 uses machine learning to automatically identify user behavior across devices and channels and generate higher-quality data for analysis and reporting.
Additionally, unlike Universal Analytics, GA4 does not rely on page tagging to capture data points, as machine learning technology can infer information about user behavior from the activity it observes on your website.

The main advantage of GA4 over Universal Analytics is its ability to provide more comprehensive insights into website visitors' engagement and behavior. For example, with GA4, users can track events such as ecommerce transactions or content downloads without relying on manual tagging or code implementation.
You can also use advanced segmentation tools to understand how different audience segments engage with your website or app. It enables you to identify areas where you might need to improve the user experience or target specific groups with tailored campaigns.
Finally, GA4 also offers new reporting features, such as cross-device attribution models, that give you a better understanding of how customers interact with your brand across multiple devices and channels.
GA4's Capabilities
Google Analytics 4 (GA4) is Google's latest analytics offering that gives users the power to measure web and app performance with enhanced data collection, insights and metrics reporting. With GA4, users can better understand their visitors' behavior across all of their digital channels, allowing them to make smarter decisions that help grow their businesses.
At its core, GA4 offers users seven main capabilities: enhanced data collection, automatic event tracking, custom reports, audience segmentation, predictive insights, machine learning-powered marketing optimization, anomaly detection, and integration with Oracle to BigQuery and other Google Cloud Platform tools.
Enhanced data collection gives users a more comprehensive view of user actions on the website or app. With GA4's automatically collected events and user propertiesāwhich are attributes associated with a particular user, such as age or gender users can access more detailed information about how visitors interact with their site or app. It allows them to track pageviews and specific user behaviors such as downloads, forms filled out on the page, and even custom events set up by the user.
With automatic event tracking in GA4, users can easily track visitor interactions without having to set up any code manually. It makes it easier for those who could be technically savvy to glean valuable insights from their data. And those familiar with coding languages like JavaScript or HTML/CSS now have more control over what custom events they want to track on their sites or apps.
GA4 also has powerful audience segmentation capabilities that allow users to create targeted audiences based on visitor behaviors, such as visits to specific pages or time spent on the site. It will enable marketers to gain insights into what kind of content resonates best with certain segments of visitors so they can adjust campaigns accordingly.
Predictive insights in GA4 use machine learning algorithms to forecast future customer behavior based on past performance trends and current inputs. For example, if you've been running a campaign for several months now and want an idea of how much traffic it will drive next month, you can use this feature in GA4 to get an estimate based on current trends and other factors that might influence your results.

The machine learning-powered marketing optimization feature in GA4 helps marketers optimize campaigns by understanding how different campaigns affect each other to identify which combinations will bring the best results for a given goal, such as increased revenue or higher click-through rates. This way, marketers can find the sweet spot for their campaigns where they'll be most effective at driving conversions rather than just throwing money at random ads hoping something works out.
Finally, integration with BigQuery and other Google Cloud Platform tools lets users connect data from multiple sources - such as Ads campaigns - to gain deeper insights into customer behaviors and trends across channels so they can make more informed decisions about how best to market their business online.
Exploring Datasets Available for Each Dimension in GA4
When exploring datasets for Google Analytics 4 (GA4), there are several dimensions you can use to gain meaningful insight into user behavior and website performance. These dimensions include Acquisition, Behavior, Conversion, and Lifetime Value.
Each dimension provides a wealth of information that can help marketers better understand the customer journey and optimize their campaigns.
1. Acquisition Dimension
The Acquisition dimension provides insight into how users have come to your website, such as through organic search, social media, and email campaigns. It can show data on where users are coming from geographically and the devices they use to access the site.

2. Behavior Dimension
The Behavior dimension offers insight into user engagement with your website after arriving from an acquisition source. You can view metrics such as total pageviews per session or time spent on a page. This data is useful in understanding how visitors interact with your content and identifying pages that need improvement. You can use this data to track user flow through your website and identify areas of interest or opportunities for enhancing navigation between key pages and potential conversion points.

3. Conversion Dimension
The Conversion dimension shows how users convert after landing on your site from acquisition sources. It will display the number of conversions achieved by each source type over a given period so you can easily compare performance across channels and identify opportunities for improvement. With this data in hand, you will be able to measure campaign ROI more accurately and optimize for conversions more effectively. You can also fine-tune different strategies based on what works best for each channel's unique goals and objectives.
4. Lifetime Value Dimension
Finally, the Lifetime Value dimension offers long-term insights into how customers' behaviors change over multiple visits to your website and interactions with different marketing channels throughout the customer journey.
It includes tracking purchases made by returning customers or any changes in user engagement levels over time, which provides valuable information for optimizing a site's overall performance across all acquisition channels over the long run.

By understanding which customer segments contribute most heavily toward lifetime value metrics like revenue generated or purchase frequency of repeat customers, businesses will be better equipped to tailor their marketing efforts accordingly. They can also maximize customer loyalty rates and drive overall value from each customer segment over time with this metric.
Utilizing the Feature GA4 Dimensions in Analytics Reporting
Google Analytics 4, or GA4, helps businesses and marketers track, measure, and analyze customer behavior. GA4 Dimensions are an advanced reporting feature within the platform that enables users to gain greater insights into customer behavior by tracking specific metrics.
This feature allows users to segment their data more effectively to gain new insights into customer behavior. With GA4 Dimensions, users can create custom reports that pull data from multiple sources (such as web pages, events, and campaigns) and view the results in one place. This powerful reporting feature gives users more detailed information about their customers' activities than ever before.
Additionally, the GA4 Dimensions feature allows users to set up alerts to be notified when specific conditions are met. By staying on top of customer behaviors through these notifications, businesses can make decisions faster and target their marketing efforts more effectively.
Difference Between Metrics and Dimensions in Google Analytics
Metrics and dimensions are the two main components of Google Analytics. Metrics are quantitative measurements, while dimensions are qualitative ones.
Metrics measure the performance of websites, such as page views or unique visitors. They provide a numerical value that can be used to compare different sections of a website or even different websites. By understanding metrics and how they interact, website owners can make informed decisions on where to improve their websites or strategies.

On the other hand, dimensions do not provide numerical values but rather help describe data by putting it into context. They include factors such as geographic location and device type, which help users understand how visitors interact with a website or app. With dimensions, marketers can gain an understanding of user behavior across different segments and make informed decisions about how to reach those audiences better.

Both metrics and dimensions are important for understanding visitor behavior and optimizing campaigns for success. While metrics provide a quantitative view of performance, dimensions are essential for gaining an in-depth understanding of user behavior and creating targeted campaigns that resonate with users. By combining both, marketers can get an accurate view of their campaigns' performance and which areas need improvement.
Custom Dimensions in GA4 and How to Use Them Correctly?
Custom Dimensions are an important tool in Google Analytics 4 (GA4) that allows users to collect information about their website and app users from sources outside the default GA4 metrics. With Custom Dimensions, you can gain a deeper understanding of user behavior by capturing data about specific traits or events on your site or app.
For example, if you own an ecommerce store, you can use Custom Dimensions to track which product categories customers are viewing and buying from most often, or which discounts they're taking advantage of.

With Custom Dimensions, you can tailor your analytics reporting to fit your exact needs. You can create unique dimensions for any user trait or event important to your business. Once set up, the dimension values will appear in Google Analytics reports like Lifetime Value (LTV), Cohort Analysis, Funnel Analysis, and more.
To ensure accuracy when using Custom Dimensions in GA4, it's important to define each dimension carefully before setting them up in your account. It includes giving clear labels and descriptions for each dimension so that it's easy to understand what the data represents.
Additionally, ensure you're familiar with sub-dimensions associated with each dimension to get granular data points. Lastly, ensure that all data is correctly formatted according to GA4 requirements; otherwise, it may not appear correctly in reports.
Overall, Custom Dimensions offer a powerful way for businesses to gain further insights into user behavior and preferences to make better decisions based on their data analytics.
By learning how to use custom dimensions effectively in GA4 and following best practices when setting them up, businesses can maximize their analytics efforts and draw actionable insights from their data points.
Real-World Examples of GA4 Usage
A great example of usage of Google Analytics 4 (GA4) is from the NBA's online streaming service, NBA League Pass. The NBA uses GA4 to track customer behavior and engagement on their platform, allowing them to better understand customer needs and preferences. With GA4, the NBA can see how often subscribers watch games, what content they watch most, where viewers are located geographically, what devices they use, and more. By gathering this data, the NBA can create a better customer experience by personalizing content and messaging tailored to customer interests or locations.
Another example of GA4 usage comes from the home improvement industry. Home improvement retailers like Lowe's use GA4 to track user behavior on their websites to meet customer needs better.
By analyzing customer data in GA4, such as what products customers are searching for most or how long customers are spending on certain website pages, Lowe's can determine what changes need to be made to ensure a positive consumer experience.
For example, if customers struggle to find certain products within the website's navigation system or the checkout process is too difficult, these issues can be fixed quickly based on the insights gleaned from GA4 data.
Summing Up
Overall, GA4 is a powerful tool for unlocking valuable customer insights across multiple platformsāhelping marketers ensure success in their digital campaigns through greater visibility into customer behavior and needs. The key advantages of GA4 include the following:
- It offers many use cases that allow marketers to better understand their customers.
- It enables granular control over data measurement.
- It facilitates improved customer segmentation.
- It enables deeper insights into user flows.
- It provides valuable metrics related to user engagement.
- It helps inform successful digital campaigns through greater visibility into customer behavior and needs.
By correctly understanding how to use GA4's datasets, metrics, and custom dimensions, you can get insights into your website traffic that was not possible before.


How to Generate Your Marketing Report? 5 Things You Must Include (And 4 to Omit)
Your marketing report is crucial to the success of your business. It provides deep insights into your business and answers some of the toughest questions. Some of these questions are as follows.
- How Successful Your Previous Marketing Campaign Was?
- How Can You Persuade Your Client to Approve More Budget?
- How Would You Justify This to Your Client?
- What to Do if You Are Not Getting the Expected Results?
Your marketing report provides you with key insights into the campaign. It gives you a clear picture of your business's performance and the measure you need to take to do to grow it. This information is equally valuable for the key stakeholders, including your marketing team.
This article will discuss what to include in your marketing report and what you shouldn't. By the end of this article, you will also learn how to save time through automation.
What Is a Marketing Report?
A marketing report displays data from different sources but is more than just a bundle of aimless data. Your marketing report would be relevant if it shows where you stand and helps you meet your business goals. It presents data using the desired KPIs (Key Performance Indicators) and OKRs (Objectives and Key Results) to achieve this. The more closely your KPIs and OKRs track your performance, the more relevant your marketing report is.
Normally marketing reports provide insights into the following:
- Business Goals
- Different Ad and E-mail Campaigns
- Desired Results
- Marketing Strategy
- Promotion Campaigns
- Market Research and Analytics Data
As explained above, your marketing report should aim to provide you with the crucial data you need to make important business decisions and modify your strategy.
It includes sorting, filtering, and arranging data. We can easily eliminate 80% of the irrelevant data and use the most useful metrics to generate an effective report. It also proves that you only need a small amount of crucial data to make a decision.
Loads of data and unnecessary metrics will only create unnecessary confusion.
So, as a basic rule, you should determine the report's purpose first.
Generating a report becomes easier when you have a distinct purpose and well-defined objectives.
You can easily filter the information that will shape your marketing strategy. The lonely numbers are not going to help you. Every data set that you provide should have a specific purpose. Secondly, the report should compare two sets of numbers, so we can measure the performance and take necessary action to improve it.
5 Things You Must Include in Your Marketing Report
Let's dive into the five crucial things you should include in a marketing report to make it useful for your stakeholders.
1. SEO Data and Website Analytics
Your marketing success depends on your website traffic and the actions visitors take on your website. You can refer to your website analytics and SEO data to get these insights. The traffic numbers give you a clue about the size of your reach, whereas the actions they perform on your website tell you what you need to do to convert them.
You can further split the traffic numbers into the following three metrics.
A. Unique Visitors
These are the number of individuals visiting your site. For example, suppose someone visits your site four times for different purposes, and another person visits your website two times. In that case, it indicates that you received six website visits with two unique visitors.
B. Paid Traffic vs. Organic Traffic
The source of traffic is also an important metric as it tells you how paid and organic campaigns are performing individually. You can focus on those sources where ROI (return on investment) is more.
C. Blog Traffic
If you have a blog, you must know the number of subscribers, monthly readers, and visitors per day. Once you have all the website stats, you can add a little context to each data set.
Here are the benefits of using these metrics -
- Identify Traffic Patterns - These numbers would help you to study traffic patterns and how the pattern changes on a weekly and monthly basis.
- Identify Performing and Non-Performing Assets - These insights will help you identify the pages with the most visitors. Additionally, you'll also know which pages are consistently receiving traffic. You can easily achieve more success if you increase your efforts on these pages.
Carefully examine the underperforming pages and figure out what you need to change on these pages to make them perform better.
SEO Data Points
SEO stats provide you with deep insights into your website visitor behavior.
- Average Site Duration - This metric indicates engagement on your website. It also tells you if your site matches the intent of the visitors or not.
- Pay Per Click - This metric tells you whether paid advertising is effective for your website.
- Page Rankings - This is a crucial metric that tells you how visible your website is on SERPs (search engine result pages.)
- Attribution - This metric tells you the source of your traffic. It becomes crucial when you have a diverse range of traffic sources and would like to compare the campaigns you are running to bring traffic.
Google Analytics is the source where you can get all this information.
Pro Tip: If you use DashClicks, you will get access to the Analytics app, which brings a diverse range of analytics data from different sources and third-party software programs. Moreover, you can access all the relevant data on a single dashboard. It saves you a lot of effort and time since our white-level platform has several powerful automation apps to make life easier for the agency owners.
2. Campaign Goals
As discussed earlier, marketing is responsible for ensuring the success of your business. Therefore, it becomes crucial to set and measure campaign goals. These goals provide a perspective to your marketing team, so they can figure out the actual numbers to compare different metrics.
To achieve this, you should have a good understanding of your goals. A good marketer easily understands how different campaign elements can fit into a bigger picture to make it meaningful.
Goal setting may include the following items -
- Monthly Revenue Targets (Or Annual Budget)
- Traffic Targets (Split Data by Sources of Traffic)
- CSAT (Customer Satisfaction) Score
- Inbound Leads With Their Sources
- The Conversion Rate on the Website (Given the Entire Marketing Funnel)
Together, the above data and metrics provide a specific reference frame through which you cannot only tweak your marketing strategy but also know what your teams are doing and how they're doing it.

3. Prospects, Leads, and Customers
We have discussed a lot of metrics above, but it is only useful once it translates into money in any business.
So, we further split our traffic into engaged contacts, marketing qualified leads (MQLs), and new sales qualified leads (SQLs).
A. Sales Qualified Leads (SQLs) - These are those prospects with a high level of engagement and who are ready to speak with salespeople. Sometimes, you have to nurture marketing-qualified leads into sales-qualified leads through several meetings, touchpoints, and imparting product education.
B. Customer Acquisition Cost (CAC) - It is a metric that tells you the cost of adding a new customer.
C. Cost Per Action (CPA) - You expect your prospects to perform various actions, such as signing up for a trial, form submission, and downloading an eBook or gated content.
D. Attribution - It tells you everything about leads and their sources. This metric also helps you know where the quality leads are coming from, so you can focus more on those sources and eliminate the rest.
There are various ways to identify MQLs and SQLs, some of which are as follows.
- Tracking Engagement
- Visitor Tracking on the Website
- Forms SubmissionsE
- Event Signups
- Webinar Attendees
- Free-Trial or Newsletter Signups
4. Data Interpretation
Lonely numbers are useless. You need to add some context and support your data through stories to make the data more relevant and useful. Wrong data interpretation might lead to incorrect assumptions, and you should avoid that at all costs.
For example, a traffic dip can happen for many reasons, such as a long vacation, public holidays, or website issues.
The right interpretation of data is also crucial for your peers, executives, and your bossā€”it provides clear explanations of why there are fluctuations.
5. Social Media Stats
Suppose social media is an integral part of your marketing efforts. In that case, you should always include social media metrics in your reports that track your performance against brand awareness goals and conversions from social media campaigns.
Businesses heavily use Instagram, TikTok, and Facebook for conversion and brand awareness. So, you can use their analytics for the purpose. Social media platforms provide you with lots of insights and analytics so that you can measure your campaigns' effectiveness. These insights include likes, shares, retweets, impressions, number of followers, and engagement. With the help of this data, you can also find relevant information about audience demographics, ad performance, and virality.

Things Not to Include in Marketing Report
Ā You should not include the following things in your marketing report.
1. Jargon
Avoid jargon and the terminology used by the people in your industry at all costs. It can be confusing for everyone.
2. Irrelevant Metrics
Avoid all sorts of metrics that are unrelated to your core values or business goals. For example, Google Analytics provides you with vast SEO data that contains a lot of information on search engine rankings, their variations with keywords, bounce rate, etc., and most of it is useless.
3. Graphics or Charts That Contain Non-contextual Information
To make their report attractive, marketers sometimes load it with unnecessary graphs and charts containing much non-contextual information. Without an appropriate context, your audience may not interpret the information included in the graphics. It needs to be clarified.
4. Irrelevant Data
Marketers use platform-specific analytics and analytics from several third-party tools. It might contain excessive data. According to the experts, 80% of the data provided by the analytics tools is irrelevant. It can be confusing for a naive person and even experienced decision-makers. So, avoid it.
Final Words
Report generation is a tedious task. You can use the tips in this article to compile a professional marketing report useful for decision-makers. Yet, manually generating reports can be time-consuming, wasteful, and tiring. DashClicks' InstaReports is a powerful automation tool that simplifies the report generation process. Agencies find this tool highly useful. With this reporting tool, you can generate professional marketing reports in seconds. The tool fetches information from numerous third-party software and DashClicks' Analytics app.


Track Progress Against Key Objectives With Custom Goals Using DashClicks Platform
Everything depends on your ability to help your clients run their sales engine. To win the trust of your clients, you need to consistently hit their revenue targets.
So, what's your approach to ensuring you're on track?
Goal-setting and tracking are the most realistic and productive tactics an agency can use to crank up its sales numbers.
These tactics would also help your campaign sail smoothly, besides keeping the ad spend on the budget.
But then the next big question is how to measure and track your performance as your campaign gets going.
Choosing a platform or software that enables you to easily track goals in your workflows can be a game changer for your agency's success. The magic lies in numbers. So, let the tool quantify the existing or modified KPIs to measure your performance.
So, let's discuss how to integrate goal tracking into your daily workflow.
Do you have clear performance benchmarks such as KPIs and OKRs (Objectives and Key Results)?
If you don't have a documented process for it and your team depends on lots of sloppy and vague calculations, chances are you'll drag it until the end of the quarter.
This article will explain how to keep your clients happy through efficient goal-setting and add goal tracking to your performance reports.
How to Set Custom Goals?
Discuss your client's business goals with them and set custom goals for them on an imaginary timeline.
Split the bigger goals into logically smaller ones and add them to the timeline.
These goals and timelines may vary with different clients. For example, you can easily break a sales target of $50 million by the end of the next year into four quarterly goals. The first goal can be a modest $10 million in sales by the end of March 2023.
You can set various other goals to achieve this target, such as increasing leads and conversions every month. You can easily calculate that if you know the size of your sales ticket.
You can further divide this goal into expected numbers from PPC, SEO, social media, and email marketing.
The results will clearly show how your agency is performing in vivid detail. You can use our InstaReports app to generate easy-to-understand reports with colorful graphics and insights.
You can save time, hit your goals faster, and create a transformational experience by leveraging the DashClicks ecosystem. It comprises a white-label dashboard and different functional apps to automate and streamline your agency tasks.
For example, you can use our Deals App, a sales pipeline management software that simplifies the entire sales process. Or, you can use our Analytics App to track everything. Enjoy the power of automation when managing leads and deals within your sales pipelines CRM software.
On the Dashboard app, you can see the goals where you are on track, off track, or "already achieved" status.
General digital marketing goals also come in this periphery. For example, you can set a goal of making 50 backlinks on high-domain authority websites or increasing the number of leads through Facebook advertising by 100%.
Measuring these goals on a timeline will indicate your position.
Show the Value You're Providing to Your Clients
When you set the right goals and achieve them, you show the enormous value you bring on board, but if you set the wrong goals, your entire hard work goes in vain. It may disappoint your clients. Setting false expectations is a major cause of client churn.
Pro Tip: Set achievable goals and adjust them every quarter after discussing them with your client. The more consistent you are in achieving your goals, the longer you will be able to retain your client.
Using a white label dashboard is extremely helpful in measuring and achieving your goals. It allows you to choose the most desired metrics on the Dashboard's home page, making it top of mind. It keeps your entire team on the same page and encourages them to collaborate to consistently achieve their goals.

Adding these KPIs to the performance reports will help your client understand what is happening, boosting transparency and trust.
Setting the KPIs and other goals and adding them to every report you generate also serves as the education your internal and external stakeholders need. Your teams are your internal stakeholders, whereas your clients are external stakeholders. Using specific KPIs and goals help your team to seamlessly collaborate and work in unison.
How to Track Custom Goals Using DashClicks Platform?
It is one of the easiest applications to navigate within the DashClicks platform. It is so important that it displays summaries from different applications through widgets, so you can have a bird's-eye view of the entire campaign and where you stand. Colorful graphics make complex data easy to grasp and understand.
See how it clearly showcases the new leads, the leads won, and the leads lost, so your team can act in the right direction. You can easily customize your dashboard experience.

Below you can see the website analytics.

The visitors and page view stats give you a rough idea of the incoming traffic pattern.
Here is a tutorial video on how to use our Dashboard App.
The DashClicks white-label platform offers 65+ integrations with third-party apps and platforms. Some of the integrations are mentioned in the following screenshot.

Here is the screenshot of the Facebook Ads summary from the Analytics App -

The Facebook Ads tab provides you with the summary.
The new overview section will appear when you integrate your Facebook Ads account with the DashClicks platform.
So if you want to see how many times one of your ads appears on screen for a user, check" "Impressions."

Here we can also check CPM or Cost Per 1000 Impressions.

You can also check Conversions, which is an important metric.

Conversion often hints at an action a customer must complete, such as signing up for the newsletter, adding an item to a cart, downloading an eBook, or making a purchase.
The Dashboard will also tell you the amount you spent on completing a single conversion.

And finally, check the ROI on your Facebook ad spend.

Similarly, you can also get campaign insights in DashClicks.

Final Words
This way, DashClicks” white-label platform makes life easy for agency owners. You can save time and money through DashClicks” automation tools. Ensure your success by automating your agency’s goal-tracking process. It brings all the insights to your fingertips without wasting your time in too much back-and-forth in calculations.
It also allows you to focus on each campaign your agency runs and perform in-depth analysis. Transparency would pay off in a big way soon. Tracking goals will ensure your agency’s success by managing client expectations. Last but not least, quickly identify problem areas to fix and showcase your success.


YouTube Analytics: How to Use Data to Grow Your Channel Faster
YouTube analytics is critical to YouTube marketing strategy. If you use YouTube for business, you must know how to deep-dive into YouTube Analytics.
Irrespective of whether you use YouTube as a marketing platform or plan to earn money directly from your YouTube videos, you need to understand what’s working and what’s not.
When you dive into different YouTube metrics, you get to uncover important details. This information includes traffic sources, keywords users use to find your videos, and audience demographics. In all, you gain valuable insights that help you refine your content strategy with the passage of time. It simply makes sure people continue watching your YouTube videos.
In this post, we’ll discuss how to use YouTube Analytics to grow your channel. Let’s begin:
How to Use YouTube Analytics?
Before you learn to leverage the benefits of YouTube Analytics, you need to know where you will find the data. Here are the steps you can follow for the same:
How to View Analytics on YouTube?
- Log in to your YouTube account.
- Click on your profile icon. You can find it in the upper right corner.
- Select “YouTube Studio”.
- You will be shown a few summary metrics. For even deeper analysis, click on “Analytics” or choose “Go To Channel Analytics.”
- Now, you can easily toggle between Reach, Audience, Engagement, Overview, and Revenue. You will find different metrics in each of these tabs (talked about in detail in the next section).
- To see an exhaustive breakdown of your channel analytics, you can choose “Advanced Mode.” Here, you can also dive into the detailed metrics for each video.
- In the “Advanced Mode,” you can also choose “Compare To.” You can find it in the upper right corner. Once you click on it, you can check how your videos perform against your entire channel and even the year-on-year growth of your channel.

How to View YouTube Analytics on Mobile?
Here are the steps you need to follow to see YouTube Analytics on your mobile device:
- Download the YouTube Studio app.
- Sign in to your account. You will come across some summary metrics.
- Toggle between Reach, Audience, Overview, and Engagement. Here, you can find different metrics in each tab (discussed in detail in the next section).

All About YouTube Metrics
Now that you know how to see YouTube Analytics, here's everything you need to know about YouTube metrics.
YouTube Channel Analytics
You can find these metrics by choosing the Overview tab. You can use such metrics to identify average trends and chart your complete channel performance.

1. Realtime Views: The number of views that your videos got in the last 48 hours. You will see this data in the form of a bar chart with estimated hourly views.
Tip: This data can help you know how your newly updated videos perform on YouTube.
2. Subscribers: The number of individuals who subscribed to your channel over a particular time period.
Tip: Check how this information compares to your usual subscriber growth. If you note a shift from the average, look for the reason behind it.
To determine the cause behind the shift, you can check if you posted less or more videos than usual. Also check the performance of all your videos to ascertain the cause.
3. Channel Views: The number of views your complete channel received over the time period you choose.
4. Top Videos: Your top-performing videos on the basis of their views over a certain time period.
5. Channel Watch Time: The total time individuals spent watching all your channel videos, in hours (calculated over a particular time period).
Tip: Select a 28-day timeframe to compare this information with your average watch-time.
YouTube Reach Metrics
These metrics help you know how people are discovering your videos (in and outside of YouTube). These insights help you make any necessary tweaks to your strategy.

1. Impressions: The total times your video thumbnails were displayed to YouTube viewers.
2. Impressions Click-Through Rate (CTR): The percentage of individuals who clicked on a thumbnail on YouTube to watch your videos.
A high CTR signals that you have done a great job with your keywords and thumbnails.
Listen Up: Check for similar patterns in videos that have low or high CTR. Doing so will offer you insights into what prompts your viewers to click.
3. Top YouTube Search Terms: The top search terms individuals entered in YouTube search that led them to your videos.
This information gives you an idea about your current YouTube keyword strategy. It helps you understand whether you need to make improvements to it.
4. Traffic Sources: Where and how individuals are finding your videos.
Examples of YouTube traffic sources include suggested videos, browse features, search, and playlists.

Listen Up: When you take a look at traffic sources, you also learn about potential collaboration opportunities. You can check “Suggested Videos” to know which channels are driving traffic to your channel.
YouTube Engagement Metrics
Engagement metrics help you know how individuals interact with your videos.

1. Average View Duration: The amount of time your average viewer sees your videos before they click away.
Listen Up: A low average view duration means people watching your video are not getting what they expected from the video after clicking.
2. Top Playlists: Which playlist has the highest watch time overall.

Tip: To increase the performance of your lower-performing playlists, you can always reshuffle the order. Find the video in the playlist that has the highest average view duration and move it to the top position.
YouTube Revenue Metrics
You can go to the Revenue tab to track your earnings (if your account is eligible for YouTube monetization features).
1. Estimated Ad Revenue: The estimated revenue for AdSense and DoubleClick ads for the chosen parameters.
2. Estimated Revenue: The net revenue your channel earned over a chosen time period from all Google-sold ads and transactions.
3. Transaction Revenue: The estimated net revenue from transactions such as Super Chat or paid content for your chosen parameters.
YouTube Audience Metrics
YouTube audience metrics help you gain insights into who watches your videos. This helps you devise effective content strategies.

1. When Your Viewers Are on YouTube: This is a bar chart that shows the times and days most of your channel viewers are on YouTube.
Viewing this data will help you schedule your video uploads at the best time.
2. Unique Viewers: An estimate of the total number of individuals who watched your videos over a particular period.
3. Returning Viewers: People who have watched your channel’s video in the past and have come back for more.
High returning viewers mean that your content is striking a chord among people.
4. Audience Demographics: The gender, language, location, and age statistics for the individuals who watch your channel videos.
This crucial information helps you plan your content according to your audience.
Note: Learn how to create a YouTube content machine that drives insane traffic.
5. Watch Time From Subscribers: The total watch time that comes from your channel subscribers.
If you notice that the watch time from your subscribers is low, you can consider creating a consistent posting schedule and making sure they know about it.
YouTube Video Analytics
You should also track metrics for specific videos. From the Analytics overview screen, click on a video to check its stats.
You can use the Engagement, Reach, and Audience tabs for each video to see different metrics for the video.
1. Views: The total times your video has been viewed (includes repeat views from the same person).
2. Watch Time: The cumulative amount of time individuals have spent viewing a particular video.
Note: Watch time is a major ranking factor in the YouTube algorithm. Videos that have a higher watch time have more chances of showing up in recommendations and search results.
3. Average View Duration: The estimated time (in minutes) watched for each view of the chosen video.
4. Video Subscribers: The number of individuals who subscribed after viewing a video.
This metric is extremely important because it signals if a specific video connected with the people who watched it.
Note: You can also view the count of subscribers lost because of a specific video. This information can also help you ascertain what went wrong because of that particular video.
5. Advanced Mode: Take a look at the “Advanced Mode” reports to know how individual video stats compare to the complete performance of your channel. These insights will help you produce future videos that will definitely show a great performance.
Popular YouTube Analytics Tool
You can also use a reliable YouTube Analytics tool to know about the performance of your channel. A great example of this tool is Analytics app by DashClicks.
Set up YouTube tracking in Google Analytics for an in-depth look at how individuals reach your channel.

Using DashClicks’ Analytics App
Want real-time marketing reporting software at your fingertips? Use the best-in-class Analytics app by DashClicks. It helps you monitor and report on all your marketing campaigns in a single place.
Take a look at the features of this incredible app:
- See granular insights to make smarter marketing decisions and drive better conversions.
- Choose the date range from predefined options or create a custom date range to see all your data.
- Integrate your third party marketing and analytics integrations to the software from an ever-increasing list.
- Get accurate white label reporting quickly and in real-time.
Conclusion
Armed with the knowledge of different YouTube metrics, you can now gather a wealth of information about your YouTube channel and take your YouTube game to a whole different level. YouTube Analytics is extremely important for your business as it helps you grow your channel at a faster pace! Ensure you use the data gathered to create awesome content and gain more customers. Good luck!


How to Use Google Search Console for SEO
SEO is critical for elevating your brand's online presence.
It determines how users discover your site, what types of audiences you'll attract, and where you rank among your competitors.
There are a variety of digital tools available to assist with elevating your SEO strategy. Among these is Google Search Console, a free service for monitoring your website and generating expert reports.
Learning how to take advantage of this gift from Google will help you climb the rankings. After reading this guide, you'll be able to stand shoulder-to-shoulder with some of the top brands in your field online.
What is Google Search Console?
Google Search Console is a free service that helps brands and site owners diagnose technical SEO issues to improve search visibility.
You'll be able to watch your site performance 24/7, while also having the ability to instantly generate reports regarding keyword performance, technical SEO errors, and site security.
Anything that can have an impact on your domain's SEO value can be found by using Google's suite of tools. While it can take some time to get savvy with the service, it has zero barriers to entry making it a necessity for any online brand.
Why is Google Search Console Important for SEO?
Google Search Console is available for free as it actively helps Google to better understand the content found on your website.
While the company is not working to help your brand specifically, they do want to ensure that your content finds the ideal audience. This will help you generate more qualified leads while allowing Google to offer a superior search engine experience for users around the globe.
When you actively take advantage of Google Search Console, you’ll gain instant feedback for the following aspects of your site’s SEO:
- Checking SEO performance for chosen keywords (ranking, search volume, etc.)
- Diagnosing technical SEO issues like loading speeds or navigation errors
- Gathering reports on backlinks pointing to your domain
- Scanning for mobile website usability errors
Furthermore, you can actively help Google by creating your sitemap for navigation, or by submitting new crawl requests when completing major website changes.
You should be monitoring all of the above weekly or monthly to continuously improve your domain authority and avoid falling further down in the rankings. Without Search Console, you rely on automated, periodic check-ins that may inaccurately index your pages, while remaining oblivious to easily fixable site health errors.
How to Create a Google Search Console Account?
Creating your own Google Search Console account is a straightforward process. You can access the setup process on Google’s site here.
To get started, you will require:
- A Google Analytics account
- A domain with DNS verification
- Access to your domain name provider account (GoDaddy, Bluehost, Dreamhost, etc.)
Then, follow these steps:
Step – 1: Enter your website by either using the Domain property or the URL prefix. You’ll see examples of both auto-filled in either field.

Step - 2: It will then check to determine if site ownership has been verified by Google. Since we are creating a new account, you will see the domain ownership verification instructions next.
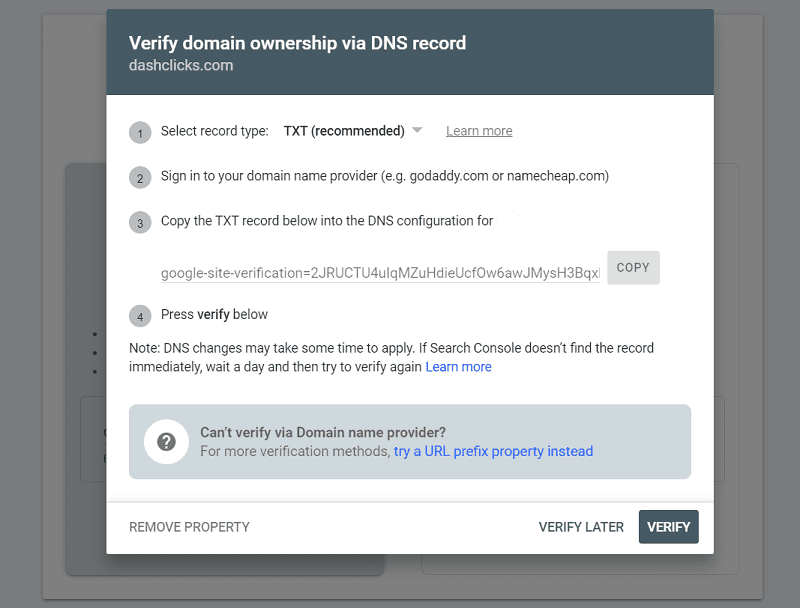
Step - 3: Choose a TXT or CNAME record type (the former is recommended). You'll then need to copy the contents of that record into your domain's DNS configuration on your domain name provider's site. Be sure to save those changes.

Step - 4: Head back to Google Search Console setup and click Verify.
With this, Google will be able to recognize you as the owner of the domain. After the verification is complete, you'll be able to access the Google Search Console tool at any time from the website or your Google Analytics account.
Note that you'll be identified as the Owner of the Search Console account. However, you can add Full Users and Restricted Users by adding one at:
Search Console > Settings > Users and Permissions > Add User
How to Use Google Search Console for SEO?
Once you reach your Google Search Console overview, you'll have access to a variety of powerful SEO tools and features. We recommend getting acquainted with one tool at a time so that you can eventually make full use of this incredible, free service.
Below, we’ll go through the service’s top features:
- Submitting a Sitemap
- Website Performance
- URL Inspection Tool
- Index Report
- Security Report
- Links Report
- Manual Actions
A. Submitting a Sitemap
A sitemap is a map of your website that you create manually to assist with the indexing process.
By default, Google's crawler will follow the links on your website and index the pages naturally. However, by submitting a sitemap, you can tell Google which pages to crawl and which to avoid for several reasons.
The necessity for a sitemap usually is determined by the website size. If you are using a basic website with just a few pages, the navigation is likely very simple allowing the Crawler to index the pages without issue. As your website size grows, especially if you begin to make use of internal linking and redirects, submitting a sitemap is considered best practice.
Your website's CMS likely has a future to create a sitemap for you automatically. This functionality is present on sites like WordPress or Wix. However, you can also create your sitemap file manually as you gain more experience.
You can find detailed instructions on how to set up your sitemap from Google here.
To submit the sitemap file:
- Click on Property and select the appropriate website.
- Under Index, click on Sitemaps.
- Enter the sitemap URL into the required field. Then click Submit.

You can also delete and replace your sitemap at any time by revisiting this section.
B. Website Performance
Your Google Search Console account will feature a Performance tab that shows off key insights about your SEO performance in real-time.
Among these include total clicks, total impressions, clickthrough rates, and average ranking position based on all of your keyword rankings.
You can also filter this traffic data by the source (web, mobile) as well as by period. You can utilize this information to focus on particular periods of high or low clicks to diagnose your SEO strategy and make the necessary improvements.
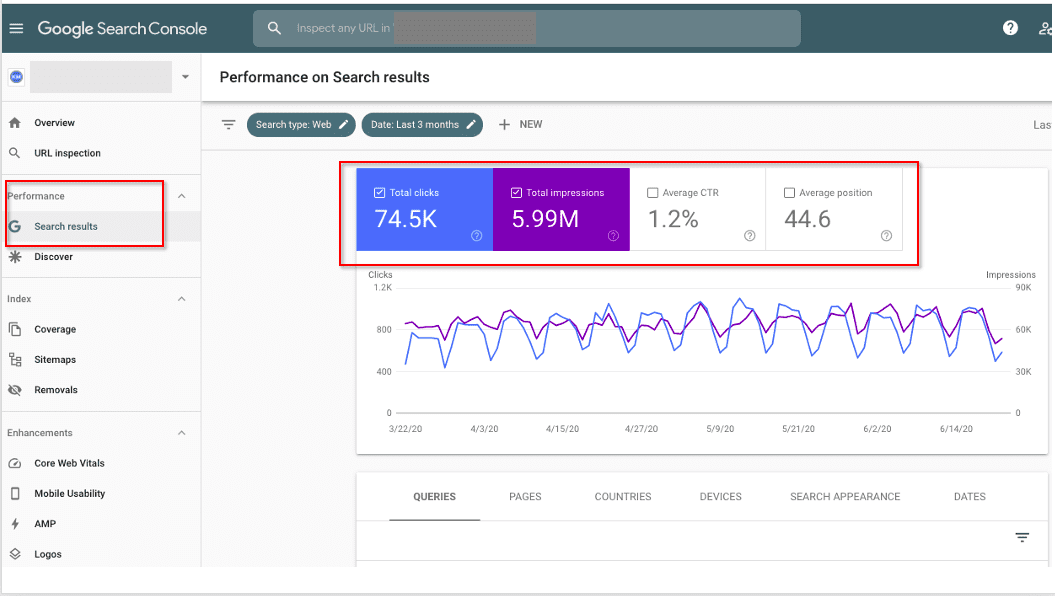
The lower half of this tab allows you to gather more specific data for several key SEO areas.
1. Queries shows the phrases or keywords users are typing to find your website as a result. In some cases, the query might contain a keyword that matches your industry but shows an overall mismatch in search intent. Reviewing your queries will help you understand how you can pivot your content to better communicate your business offerings online.
2. Pages allows you to review the traffic by the individual web page. Because you are ranking each page for a specific keyword, you can review what queries people are using to find a specific page on your domain. Trends in your performance are direct indicators of the type of action necessary to improve your SEO for that page.
3. Countries will show user metrics based on where those visitors are around the globe. If you're making efforts to market to people in different countries, you can segment your data and monitor your performance in real time by location.
4. Devices offers similar features in that you can monitor user activity based on their chosen search device. This can include PCs, tablets, smartphones, and other technology.
Performance data is critical for any marketing channel. Use Google Search Console to monitor your website performance daily and adjust your strategy as necessary to pursue continuous improvements.
C. URL Inspection Tool
The URL Inspection Tool is a popular feature that allows site owners to diagnose a specific web page.
By entering a URL into the tool, you can gain access to a report of how a Google Crawler will view this your URL. It provides reports on two key areas including Index Coverage and AMP enhancements.
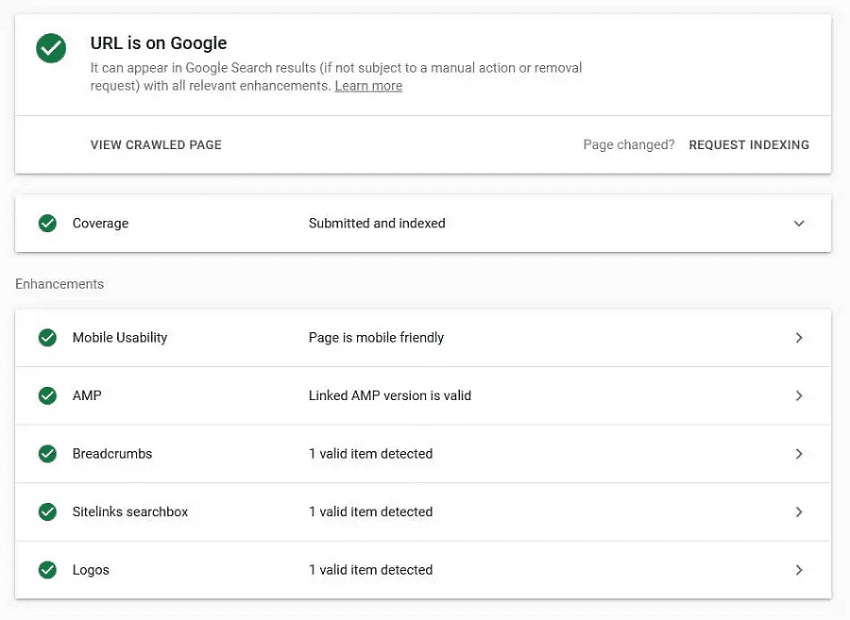
Index Coverage shows whether or not the page is crawlable and if it is currently indexed. It will also display any relevant indexing data such as whether or not this URL is included in the domain sitemap. If you are utilizing any advanced SEO techniques such as placing canonical tags on this URL, those will also appear in the report.
Likewise, any issues that are preventing this page from being indexed will appear here. You can take this actionable data and apply it to the URL so that normal indexing can resume and allow you to continue ranking.
Enhancements will first list out any notable issues with mobile browsing health. Google places a high priority on a smooth mobile experience, so you should use this data to speed things up and present your content more clearly.
You can also check in on any advanced SEO tactics like schema markup here to determine if you are implementing it correctly.
D. Index Report
The Index Report function works much like the Coverage tab in the URL inspection tool. However, instead of diagnosing one page, the Index Report shows the status of every URL found on your domain.
On the top level, this report will show which pages were indexed and which were not. You'll want to focus on the non-indexed pages and review the errors preventing the crawler from doing its job correctly. If Google cannot crawl the URL, it will not appear in search rankings nor will it recognize any SEO or content changes.
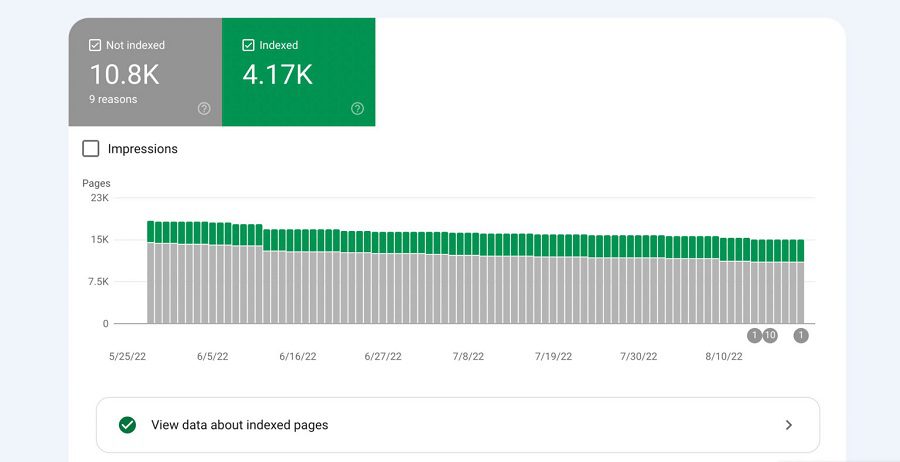
However, the report also shows more useful data as to how you can further improve pages even if they were able to be indexed. The crawler may technically be able to index the URL, but there are warning signs indicating that it may not fully understand your content and which audience it relates to.
Google provides a full list of its indexing errors as well as the actions you should take to eliminate the issue here.
E. Security Report
Unless you have security in order, you'll likely experience a hack at some point as a website owner. Even the top brands in the world face security issues that must be dealt with swiftly to protect the brand and its customers.
Google Search Console attempts to monitor and flag malicious activity by tracking actions taken on the website. The tool primarily scans for these three items:
- Hacked Content – Any unusual injections of content, back-end code, or fishy URLs pointing to untrustworthy sites
- Unknown/Unwanted Software – This applies to anything such as malware or malicious software that can trigger unwanted actions or phish for user information
- Social Engineering – Any content that deceptively coerces users into taking action is social engineering. New content may describe one thing, but lead users to download something else entirely like software or a virus
To protect users, a flag will prevent this page from being indexed and appearing in search results. You should run a security report to review the issue and take the suggested action to resolve the problem.
After you resolve the issue, or if there was an unusual misunderstanding that led to an incorrect flag, you can file a reconsideration review. Google will manually review the URL, but the process can take several weeks to complete.
Security issues are imperative to diagnose as you are held accountable. Even if you are the victim of hacking, it is your responsibility to provide a solution as soon as possible. Failure to do so can get you permanently marked by Google as an offender, making it all but impossible to rank your domain.
F. Links Report
Any time another domain links back to a page on your site, you acquire a backlink.
Backlinks provide powerful SEO benefits, particularly when they come from other high-ranking, reputable sources of information. Part of any successful SEO strategy is to deliver excellent content that's worthy of sharing across the web.
However, the inverse can occur when unreputable or malicious sites begin linking to your pages. In those scenarios, you want to know which sites are referring to your content, so that you can have control over which sites are trying to build a relationship with your domain.
The Links report will generate a list of every backlink pointing to your site. You can check out the top referral sources, see how much traffic you receive, and determine which pages get the most referral traffic.
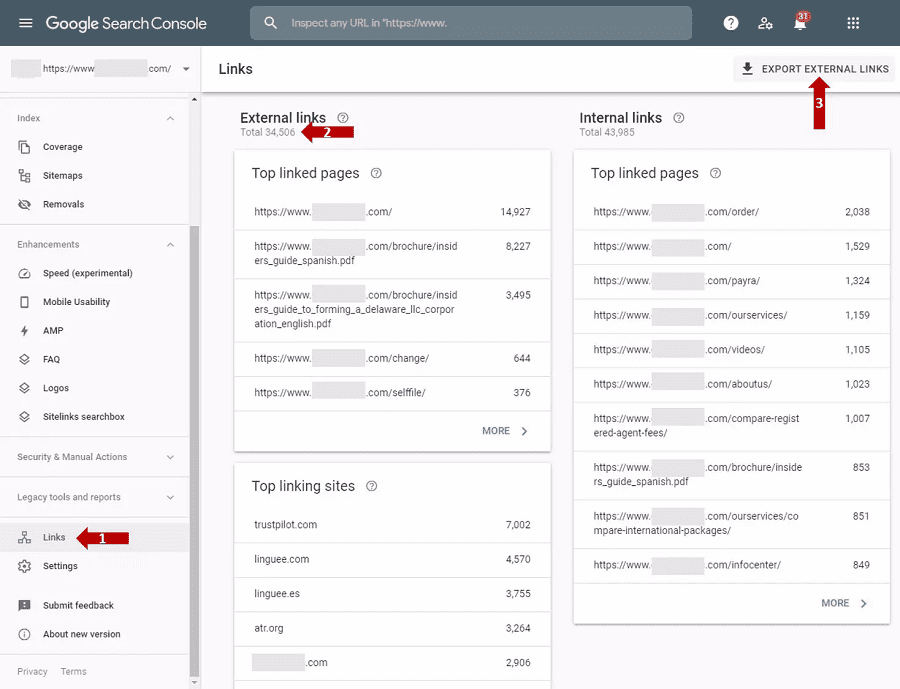
You can use this data for positive results to try and earn more backlinks on other pages that are lagging in performance. Similarly, you'll want to continue supporting valuable pages with lots of backlinks to maximize the organic benefits that your hard work is providing.
For toxic backlinks, you'll now have a list of webmasters to contact. If that link is causing problems for your SEO efforts, you have the right to ask other site owners to remove the link. Google recommends doing this before attempting to take any further action.
If you're unable to get a result, you can use Google Search Console to submit a disavow request. You will need to collect any specific URLs or domains in a list to upload to this page here.
G. Manual Actions
Finally, a Google employee always can take manual action against your domain if they find any violations of their policies. All webmasters have a responsibility to ensure that every page adheres to a set of guidelines that are listed here.
Such actions that would fall under this category might include:
- Implementing deceptive, sneaky redirects
- Scraping high-ranking content from other URLs
- Spamming keywords in an attempt to trick crawlers
- Adding pages with no real content or discernible purpose
Many of these actions are exclusively exploitative, though it is possible to find yourself flagged for issues you did not intend to cause. For instance, using a google search scraper can help you gather relevant search data efficiently, but if not used carefully, it could potentially lead to unintended issues that violate Google’s guidelines.
In either case, you can find any notifications about Manual Actions within your Google Search Console account. As with the other features, you should find a description of the problem as well as suggested actions you should take to resolve the issue.
After you resolve the problem, you'll need to manually request a reviewal of the updated page. Be sure to explain the problem, why it occurred, and what you did to correct it and prevent it from occurring in the future.
Optimize Your Website SEO with DashClicks
Improving your website's SEO is possible thanks to an abundance of free tools like Google Analytics and Google Search Console. However, the process requires dedicated effort and knowledge of the services to obtain worthwhile results. As a site or business owner, that's not always a reality.
DashClicks provides simplified ways to improve and optimize your SEO. Our dedicated Analytics software allows users to track set numbers of keywords along with important snapshots from Search Console like daily traffic, clickthrough rate, search rankings, and much more.
If that's not enough, our dedicated SEO fulfillment team has the trained personnel and resources to ensure your domain gets the love and care it needs to perfect its SEO strategy.
Start with DashClicks today by signing up for your free account and discover a new way to optimize your SEO strategy.

No results found.
Please try different keywords.
Get Started with
DashClicks Today
Get found online, convert leads faster, generate more revenue, and improve your reputation with our all-in-one platform.
.svg)
Unlimited Sub-Accounts
Unlimited Users
All Apps
All Features
White-Labeled
Active Community
Mobile App
Live Support
100+ Tutorials
Unlimited Sub-Accounts
Unlimited Users
All Apps
All Features
White-Labeled
Active Community
Mobile App
Live Support
100+ Tutorials
Unlimited Sub-Accounts
Unlimited Users
All Apps
All Features
White-Labeled
Active Community
Mobile App
Live Support
100+ Tutorials
.svg)
.svg)
.svg)
.svg)
.webp)

.svg)
.svg)
.svg)


